Graphs are essential in any finance or property-related report, or any website article that introduces various payment schedules. Because we required an effective means for our clients to showcase simple graphs on their website, and because we required a suitable means of generating custom graphs for use in our customer Venus Report (in addition to those that contextual graphs that will be submitted to your website via our article submission program), we built a very simple-to-use API to return the most common financial graphs as images. This article introduces the basic API, usage via shortcode, and the Elementor plugin.
The Result
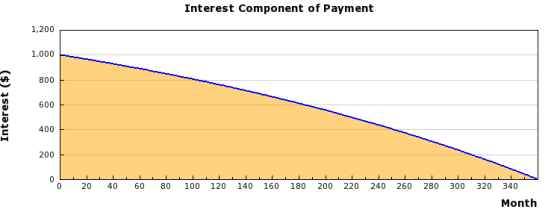
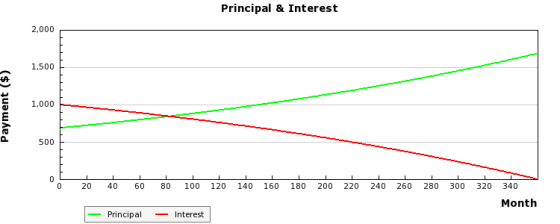
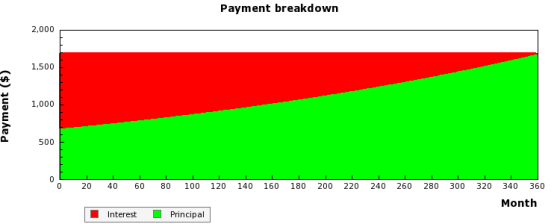
Some examples of the result is as follows. You'll note that they are super-simple and this was very intentional. Image graphs are extremely easy to use and may be copied into any other medium. We have a fancy-pants JavaScript API as well and this will be introduced in a subsequent article.
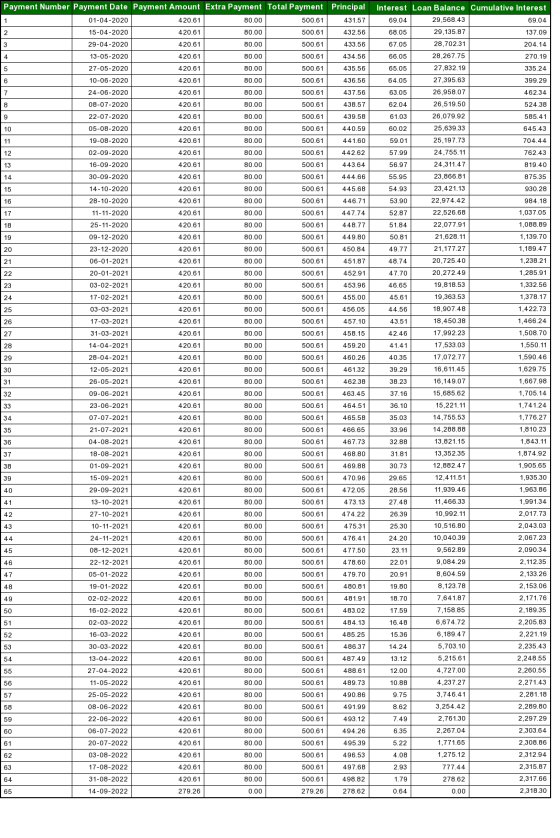
A number of amortized graphs provide monthly or fortnightly breakdowns into an image so they can be easily used in your online promotional material (such as website articles). An example is as follows:
Pictured: Four sample graphs returned via the API, and shown as they're returned to your website. They are simple and easy to use. A JavaScript (Interactive Graph) API is available for more advanced usage.
Available Graphs
Available graphs are as follows:
- Principle line graph
- Interest line graph
- Principle & interest line graph
- Loan balance line graph
- Cumulative interest line graph
- Principle & interest stacked bar graph
- Principle & interest amortisation table
API Parameters
The graphs support any rate, period, additional repayments, and frequency. A full list of API parameters are as follows:
gt (gt=plg)
a (a=400000)
i (i=4)
y (y=20)
f (f=m)
e (e=100)
fp (fp=23/02/2020)
API Response
The standard endpoint is: http://api.beliefmedia.com/loancalc/. A modified parameter returns data necessary for JavaScript graphs (discussed soon).
Standard response looks like this:
WordPress Shortcode
Clients can include the graph into a WordPress post or page with attributes equivalent to the API parameters. So, if you wanted to include the principal and interest line graph as shown above you would use the following shortcode: [loancalc gt="pilg" a="400000" i="3" y="30"].
The API makes the request, imports the image into your WordPress library, and each subsequent request for the image will reference your local image.
Elementor Block
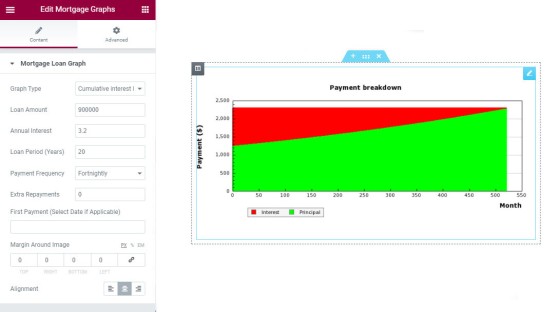
If you're a client, or you're using our standalone Elementor plugin, inserting a graph into your post or page is exceedingly simple. Simply drag the widget into your page, fill in the required fields, and you're done. The image is imported into your WordPress installation and referenced for all page views.
Pictured: In those cases where you're using Elementor to build a page, the graph is created via a simple drag-and-drop process. You select the graph, populate the values, and the graph is rendered to your page.
The Mortgage Graph widget is included as a standard tool alongside dozens of others in our client website plugin. It's a simple feature but one that may come in useful when creating your own article content.


