We've made a lot of weather-related functions, tools, and data, available in the past, and we're only now in the process of rationalising all the features into a dedicated Elementor meteorological block. Following on from an article the introduced video and GIF radar and satellite renderings, this article will introduce the updated Metar features made available in Elementor, including a new Metar graph.
What is a Metar: A Metar is just one of a large number of weather observations made available, with the Metar a real-time report relied upon heavily by those in aviation. METARs typically come from airports or permanent weather observation stations. Reports are generated once an hour or half-hour at most stations, but if conditions change significantly at a staffed location, a report known as a special (SPECI) may be issued. Some stations make regular reports more frequently. A typical METAR contains data for the temperature, dew point, wind direction and speed, precipitation, cloud cover and heights, visibility, and barometric pressure. A METAR may also contain information on precipitation amounts, lightning, and other information that would be of interest to pilots or meteorologists such as a pilot report or PIREP, colour states and runway visual range (RVR). In addition, a short period forecast called a TREND may be added at the end of the METAR covering likely changes in weather conditions in the two hours following the observation. These are in the same format as a Terminal Aerodrome Forecast (or TAF, also included in the Elementor plugin).
An example of a current Sydney Metar sourced from Yabber may be returned with the shortcode of [bm_metar station="yssy"], returning: YSSY 141930Z AUTO 16012KT 9999 -SHRA SCT035 OVC042 OVC050 19/16 Q1025 . This reports was sourced from the Yabber archives, but we could have rendered a report directly from the source with [metar loc="yssy']. The difference in attribute name for the station is simply as a result of age. It's these Metar reports that are archived in order to build a library of historical weather observations, and it's the source of data fed to Metar graphs.
Unlike most of our tools, the plugin isn't focused on the finance industry, although brokers and financial practitioners may occasionally find the information useful.
The Metar Graph
Some time back we introduced the Metar Image Graph. The primary advantage of the image graph format is that it returns in an SEO-optimised format that lives a life outside of a webpage. Making use of the same Metar API, we've recently introduced a JavaScript-based Metar graphing feature to our plugin. The new graph includes a few more features, and it takes advantage of the selected rendering that you don't get with a fixed image.
Examples
Graphs may be rendered with a specific observation frequency, with the hourly observation most common. In our first example, we'll return an hourly Sydney graph. Shortcode of [metargraph_js s="yssy" f="h" show_pressure="yes"] returns the following:
Zulu Time: Times are currently returned in Zulu (GMT). For local time in Sydney, you should add 10 or 11 hours, with the latter applied during during daylight saving. It's expected we'll introduce an option to return local time.
Note that we've used the show_pressure="yes" attribute to show the pressure line graph on page load. Shortcode attributes are detailed below, but it's likely you'll use the Elementor widget for ease of use.
When we select a frequency longer than hourly (so, the 'd' attribute rather than the h attribute, short for day and hour respectively), the graph returns the range of temperature and pressure for the day. Shortcode of [metargraph_js s="yssy" f="d" show_pressure="yes"] returns:
The frequency attribute (f) is set to 'h' (hourly), 'd' (day), 'm' (month), and so on, but when longer timeframes are applied you'll have to think sensibly about what fields might be rendered by default on page load. Dewpoint and Pressure, for example, are far less relevant over longer periods, but often entirely relevant for hourly or daily charts.
Some fields are duplicated in that they return as either a range bar or'average' line (such as temperature and pressure). The Relative Humidity fields is resolved in that it's calculated on the basis of available information, so it cannot be relied upon as entirely accurate... but it's suitable for a general appreciation. Using multiple 'range' bars tends to obfuscate the chart making it difficult to read.
Dewpoint and Pressure Range: The Dewpoint and Pressure Range aren't intended to be used with a temperature range simply because it crowds the chart and makes it difficult to read. They should be used for a purpose; for example, the dewpoint range and temperature range might be used to indicate overlap (suggesting fog), or the pressure charts might be used independently with a temperature line graph. In the next version we'll introduce options to remove some chart features entirely.
Shortcode Attributes
The shortcode attributes are designed to be consistent with the existing metargraph API. Existing attributes are as follows (more expected in the next release).
s
f
h (hourly), d (daily), m (monthly). Longer frequencies are intended for average trends, and to render temperature ranges for specific months.n
cache
height & width
sd & ed
sd and ed attribute. If historical data is requested an extended cache interval is automatically applied.The temperature_colour, pressure_colour, dewpoint_colour, average_colour, pressure_average_colour, dewpoint_range_colour, and rh_colour, determines the colour of the applicable bar and line charts. Use a 6-figure #hex value.
To selectively show or hide data on page load, use show_temp_range, show_temp, show_rh, show_pressure, show_pressure_range, show_dp, and show_dp_range. A value of 'yes' or 'no' should be used.
Elementor Widget
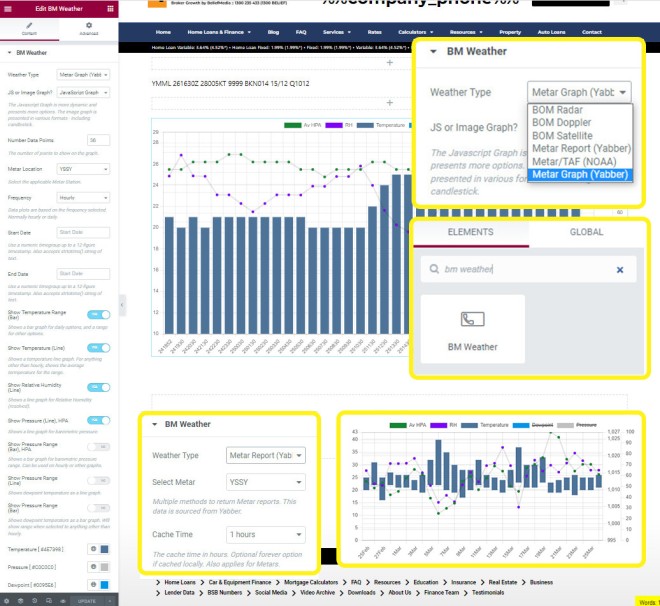
We're in the process of building a fairly comprehensive weather widget for Elementor that'll include multiple features and weather options, of which Metar data and graphing is one part. After dragging the 'BM Weather' widget onto your page, you should select the appropriate Metar option, populate the values, and the resulting data will be rendered.
Pictured: The Metar Graph Telementor options. Shown as insets are the weather select menu (each returning a set of applicable options), the Metar (text) options panel, and an hourly graph.
The Elementor option completely negates the need to use shortcode.
Conclusion
The next feature we'll introduce to the weather suite is general forecasting data (with its own graphing tools), and when complete, and in company with radar and satellite weather animations, you'll be able to render rather comprehensive weather information for most Australian locations.
There's little relevance to our core mortgage broker audience, but those that engage with Saturn will appreciate the value of the information returned to Saturn website pages, so we're playing with the idea of incorporating selected meteorological data into this module.
All weather systems are in early Beta, so if you encounter any bugs, see room for new features, or identify any areas for improvement, please let us know.


