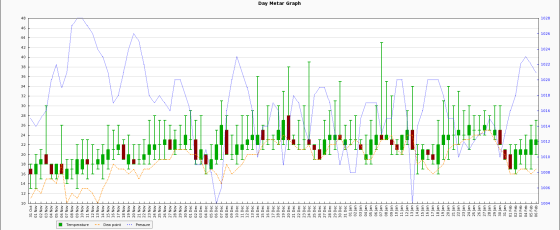
We've collected METAR reports for various stations for the better part of 20 years. In fact, we've recorded and archived Bureau of Meteorology data, ATIS reports, satellite imagery, and other information for the purpose of various type of modeling, and to provide back-end support to some of our aviation websites and/or clients, for as long as we've been around (quite frankly, we're data-hoarders). To support this meteorological data we have a bunch of different graphing tools, but the one we make available to clients for rendering METAR data (at this stage) is a super-simple image graph. This article introduces its use.
The Basic Result
Requesting temperature, pressure, and dew point data (the latter two as line-graphs) for a 100-day period back in 2018 (?er=s&s=yssy&ed=20180207&n=100) returns the following:
You will note that we're using a stock market-style candlestick graph; this enables us to return the temperature range for a particular day (low and high) but also the 'opening' and 'closing' temperature for each day (red indicating that the temperature finished lower than it started, otherwise green) - this enables trends to be identified very quickly.
Metar Elementor Block
If you're using Elementor, the easiest way of including the graphs into your pages is simply by dragging and dropping the block into your page and then selecting the appropriate station and graph to render. If a fixed graph you select the 'Permanent' option to import the graph into your own WordPress library, or you may optionally create them on our server and simply reference them to show real-time data (you don't want hundreds of Metar graphs in your own library).
WordPress Shortcode
The graph shown above may be returned directly into WordPress via the use of the following shortcode: [metargraph s="yssy" ed="20180207" n="100"]. By default we'll import the image into your WordPress library and reference that image (the expectation is that you'll be using the graph as an example, or referencing a specific range of dates). To show the image directly to screen - rather than referencing an image on our server - use library="0" in your shortcode.
API Parameters
If you're using the API for used in your own application the endpoint for all requests: https://api.beliefmedia.com/metargraph/.
s (s=yssy)
yssy'. Return all station codes in JSON format with the value of lj. Field is required. Any station we currently archive is available.apikey (apikey=xxx)
f (f=w)
n (n=14)
tg (tg=l)
dp (dp=n)
p (p=n)
im (im=n)
sd (sd=20201105)
ed (ed=20201105)
er (er=s)
Conclusion
We have a JavaScript API that is meant to emulate Google's image library in many respects with the exception that we believe ours is more intuitive (the Google graphs were so problematic in WordPress that we removed old examples). Image graphs also have the advantage in that they can be easily migrated into Word Documents and other applications without the complexity associated with messy JS code, or without having to take screenshots.


