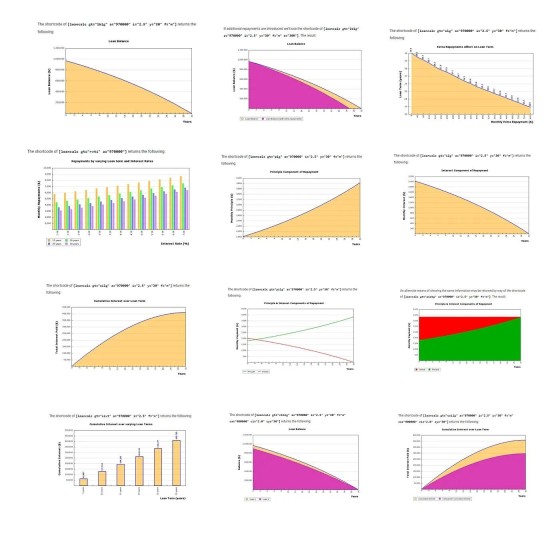
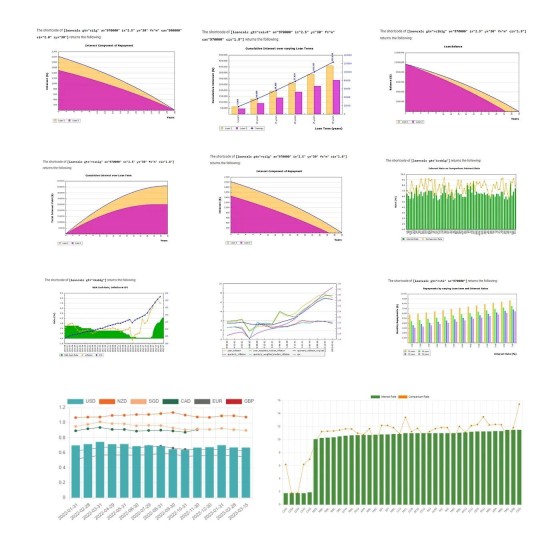
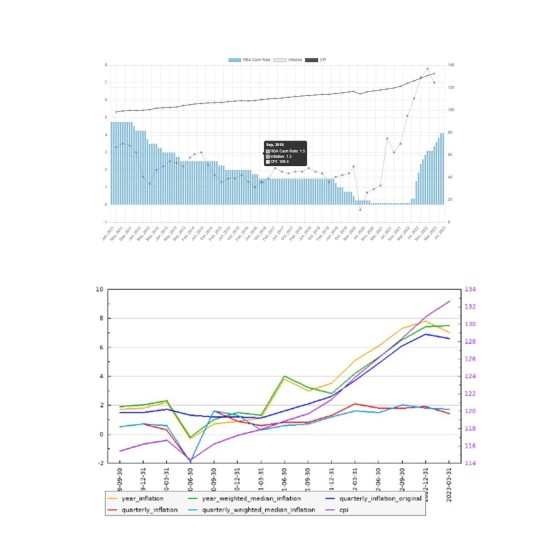
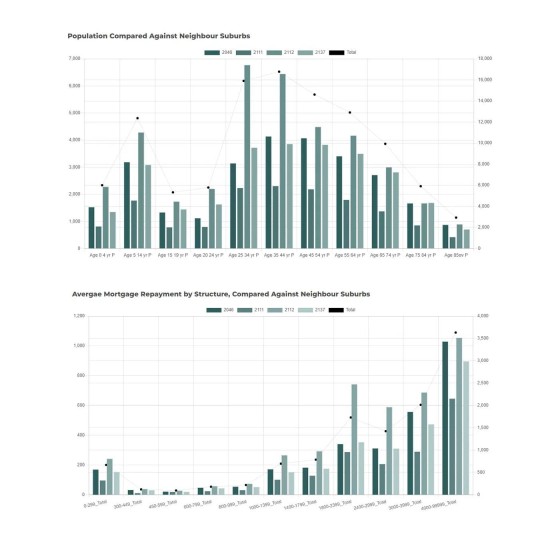
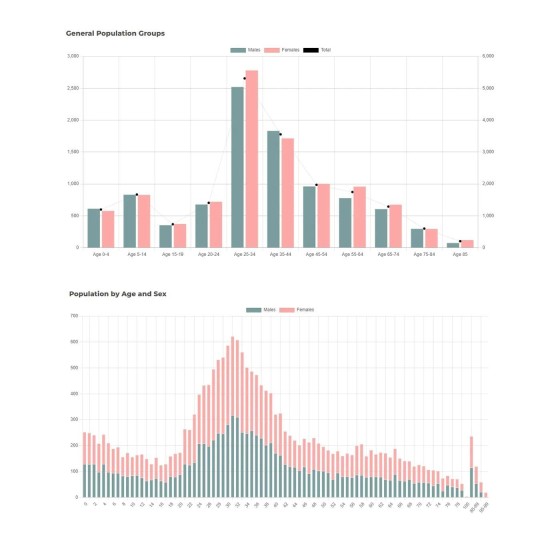
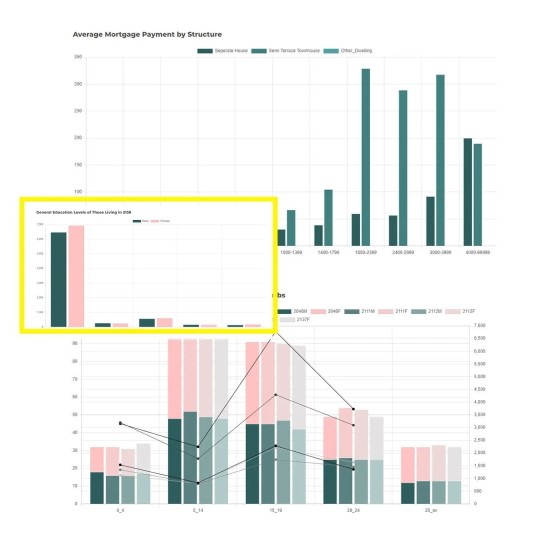
Does your digital product enable the creation of mortgage graphs for offline use and use on your website? If not, keep in mind that our free plugin provides most of what's pictured.
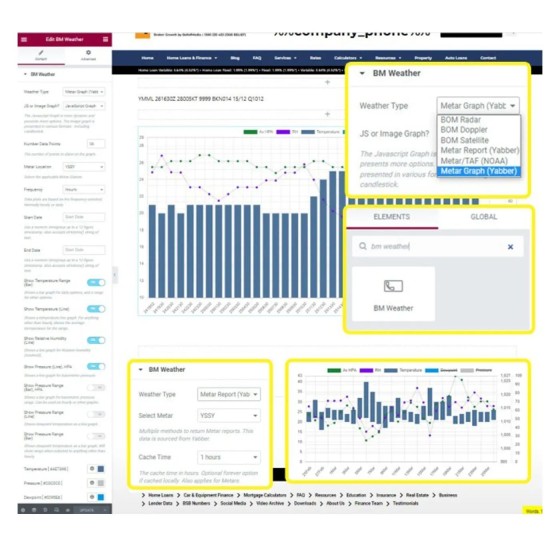
Available via shortcode or drag-and-drop Elementor block, the Yabber website framework provides for hundreds of graphs, and with the Census API this expands to a virtual infinite number.
If you have a content creation program in place (the foundation of SEO), the ability afforded by our tools enables you to create images and JavaScript graphs of virtually any type in seconds.
The image graphs are also used in PDF documents sent to clients (this is why the Image Graph API was originally created). These PDF documents are sent to users after form integrations such as the Fact Find Report.
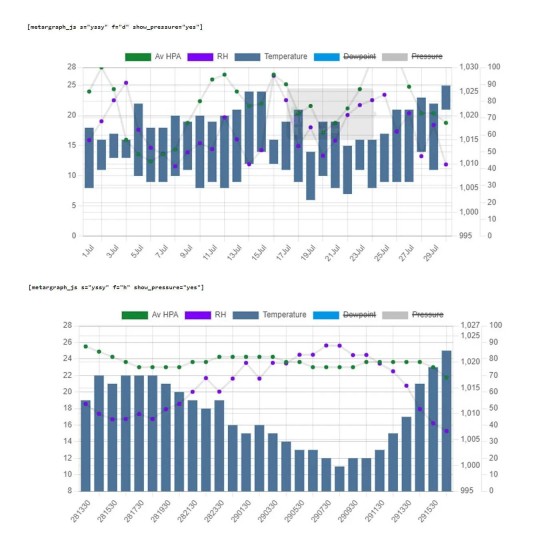
You'll see a couple of weather graphs in the array of screenshots - our graphing tools extend beyond those *required* by the mortgage market.
Dare to compare.


