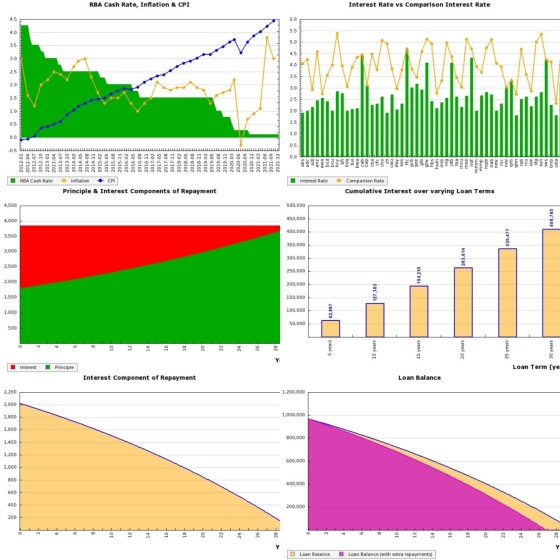
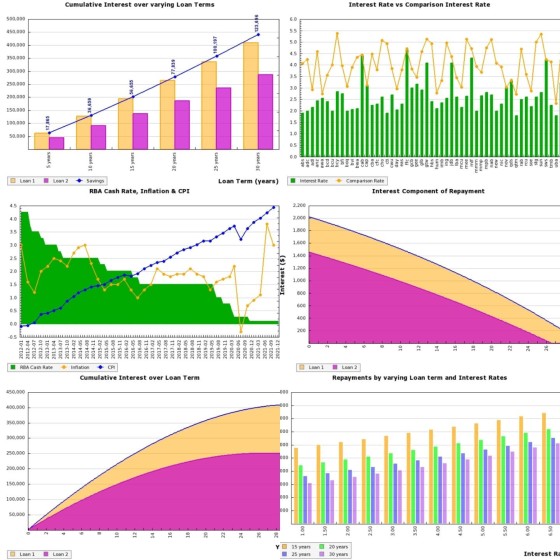
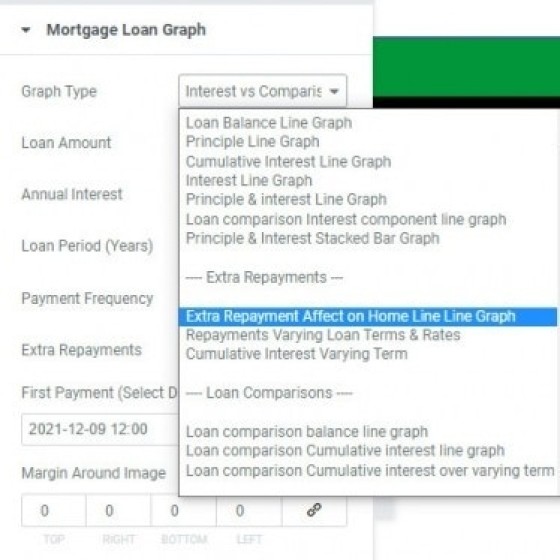
The new Image Graphing API returns up to 19 graph types to your website with super-simple shortcode (rendering a graph into a page takes no more than a few seconds).
The graphs will source live data when required (such as those that reference RBA informative), and they're perfect for inclusion in articles where a graphical illustration improves upon the understanding of complex subject matter.
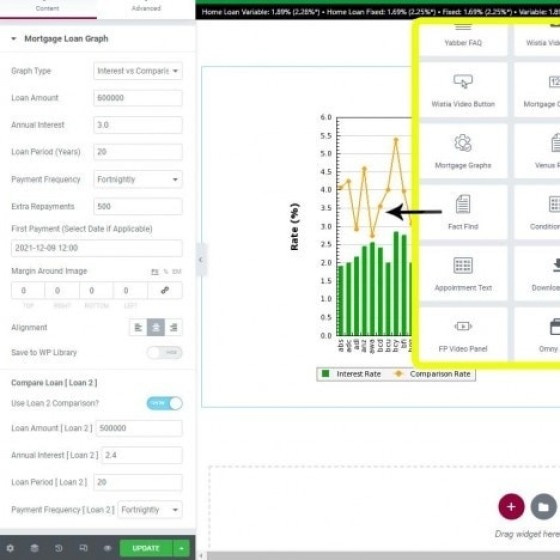
An Elementor widget negates the need for shortcode and turns the process into a drag-and-drop process.
The graphs are available on our standard website, and the shortcode will soon be made available as part of our complimentary RBA plugin.
The graphing was updated to manufacture more appropriate images for our Fact Find and Venues reports. Various JavaScript graphs contribute to be made available .


