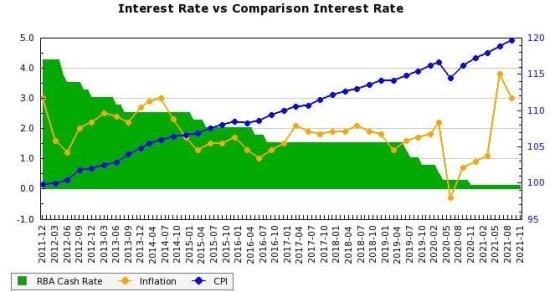
The JavaScript Economic Indicator graph made available within the BM plugin (and free BM Core plugin) is now available within the image graph library. This makes it available within Venus and other PDF reports via the use of a placeholder or Yabber shortcode.
The free Core plugin will also be updated to include this graph (titles and labels obviously have to be changed).
There's a huge library of image graphs available within Yabber... this is just the latest.


