The Currency exchange rate API is one of about a hundred finance-related API's we make available to clients via Yabber  . Government sourced, updated daily, and dating back to 1983, the RESTful Exchange API returns the exchange rate for a number of currencies compared against the Australian dollar. Useful as a standalone tool - or combined with other data sources - you're able to paint a picture of the economy in any manner that floats your boat. To make usage on your website easy a single shortcode is used to return a single conversion, and various attributes alter the output which includes an optional graph.
If you're one of our finance clients you'll be more interested in our Interest Rate and Bank Product APIs, both of which will make your page come alive with dynamic and engaging information. The number of data sources we maintain to ensure our finance and property clients are positioned to take advantage of their market is well and truly in triple digits (in almost all cases we provide an Elementor block or shortcode to return the data to your website).
The Exchange API might be more useful to those in the retail space, but it's also handy for brokers or property agents that work with international markets.
Basic Website Currency Conversions
The single currency conversion is returned to your page via the shortcode of [exchange to="usd" value="1"]%%exchange%%[/exchange], in this case returning $0.63. To return another currency you should simply alter the value. For example, [exchange to="usd" value="5"]US%%exchange%%[/exchange] returns US$3.17.
You'll note that we use the %%exchange%% placeholder. This is used primarily to support currency tooltips. For example, [exchange to="usd" value="100" modal="This is modal text, AU$100 will buy you %%currency%% USD"]US%%exchange%%[/exchange] will return US$63.47 (note the tooltip when you hover over the value). In using placeholders you simply have more control over how the tooltip text is returned.
Shortcode Attributes
Available shortcode attributes are as follows:
from
aud. Available currency: aud, usd, twi, cny, jpy, eur, krw, gbp, sgd, inr, thb, nzd, twd, myr, idr, vnd, aed, pgk, hkd, cad, zar, sar, chf, sek, php, sdr, dem, frf, esp, itl, nlg, bef, ats, fim, pte, iep, grd.to
usd. Available currency: aud, usd, twi, cny, jpy, eur, krw, gbp, sgd, inr, thb, nzd, twd, myr, idr, vnd, aed, pgk, hkd, cad, zar, sar, chf, sek, php, sdr, dem, frf, esp, itl, nlg, bef, ats, fim, pte, iep, grd.value
value="5.75").rate
decimals
background
background="#6CAE6A" or background="rgb(108, 174, 106, 0.8)".color
background="#ffffff" or background="rgb(255, 255, 255)".modal
%%exchange%% placeholder. Example: modal="The value of X USD is %%exchange%%".Currency Graphs
The graphing features made available to clients is quite extensive so we won't introduce them all here. Features to return multiple currencies in a single graph, comparative data, and so on, is all documented in various client manuals.
We return image graphs only because it's the default graphing API we use but you do have the option of rendering more interactive JavaScript graphs when required. The Exchange shortcode utilises the image graph simply because it's easier to use.
The standard RESTful response includes a single array with a key-value pair representing the X and Y axis. An additional attribute of full=true is available and will return various array formats that can easily be used in our own JavaScript graphing plugin, and Google Charts.
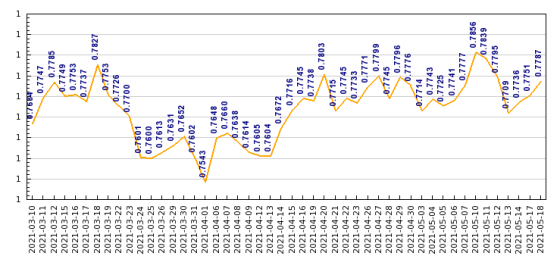
Example shortcode of [exchange_graph frequency="day" points="45" currency="usd"] will return the following graph:
Pictured: The graph shown is a static image. The chart is quite busy so our JavaScript graphing tools may be more appropriate. The JS API returns a mouseover value when interacting with the X axis. However, the image graphs are faster-loading and more easily integrated into other dynamic applications (such as PDF documents).
A more detailed graph will return something similar to the following (updated daily):
A candlestick chart is usually more appropriate and tends to add a little colour to the graph; it shown the low and high for each rendered day.
Unlike some of our other image tools, the image is saved to a dedicated directory in our client plugin (identical graphs are sourced from your own archive while dynamic images are cached for a short period). In this way we don't fill up your WordPress media library with unnecessary graphs.
Shortcode attributes include the following:
frequency
day', 'week', or 'month'.points
currency
currency="usd,nzd,cad".start_date, end_date, and days
days attribute will always use a current end_date.graph
line, bar, and candlestick. Determines the type of graph to return.Conclusion
The standard RESTful responses are obviously not documented here simply because the majority of our clients are more interested in the result rather than the method. In brief, the API will return paginated data with all or limited currencies, and up to 100 days per page (with any currency set as the primary value). Multiple formats are returned for quick integration with the most popular graphing applications, including Google Charts.
As mentioned, our standalone JavaScript plugin is usually more appropriate for interactive graphs but the image format is very easy to use, and it makes it far easier on our end when sending articles to participating business websites as part of our article distribution program (we simply include a single shortcode).
While not introduced on this page, the data may be merged with other data sources, such as the Interest Rate API.


