On 22 March, a well-defined but weak area of low pressure developed over the Coral Sea, near the Louisiade Archipelago of Papua New Guinea. It was classified as a Category 1 tropical cyclone on the Australian cyclone intensity scale at 00:00 UTC on 25 March. Concurrently, they assigned it the name Debbie. The cyclone tracked east, developing into a Category 2 cyclone by 26 March. The following day, the cyclone had developed into a Category 3, forecast to develop further into a Category 4 cyclone before making landfall the following day. It was raised to Category 4 at 10:00 UTC on 27 March.
■ ■ ■
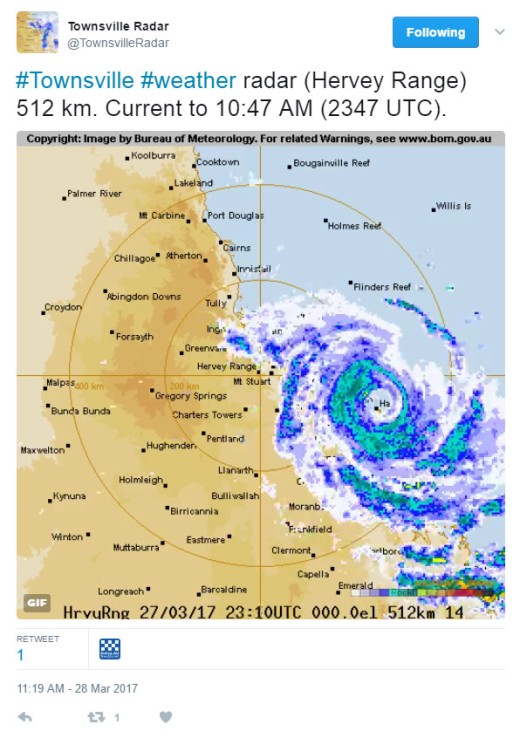
On the 29th of March, 63,000 residents from parts of Northern Queensland woke up without power and dealt with the flooding and devastation left behind  . As always, social media provided an excellent platform for those that were affected by or following the weather pattern. While Australia's Bureau of Meteorology shared radar plots
  from time-to-time on social media, they did so manually via taking a screenshot of a computer and then converting it into an animated GIF suitable for Twitter. While their sharing was effective and was appropriate, our system (as described in more detail here) could have provided them with a far easier (and automated) method of sharing any of their radar, rainfall, and Doppler wind plots pertinent to the area (on any platform). Our platform also provides for an easy MP4 conversion for easier upload to Facebook (and other platforms that prefer video).
A friend at a Sydney radio station called me and asked if I could set up a #CycloneDebbie weather-related feature on Twitter. So, within about 10 minutes the @TownsvilleRadar  Twitter account was active and tweeting away. I provided the service a little too late to be of much use to those that might have wanted it, but it is there for the next time the area is affected... and it will continue to provide Townsville radar plots indefinitely.
The image below shows an example plot (static image). See the animation here  .
.
The account currently sends a 256km and 512km radar plot alternating every 30 minutes. We'll reduce the twice-hourly posts to a single hourly animation (not unlike our Sydney  account) when the threat of the cyclone has well and truly passed.
Weather for News Media
While our account is rather generic, our client platform provides news agencies with a one-click solution to manufacturing animations or locating relevant satellite plots - making it decidedly easy to share this information across social. It's an extremely cost-effective solution that we'd be happy to discuss with interested news outlets. The same solution might be suitable for those working in the aviation or marine industries. The underlap map image (and other information such as roads, rivers, terrain etc.) can easily be customised to draw attention to specific locations.
Update: 30th March, 2017
As the dwindling low pressure system makes it way south, we've set up @BrisbaneRadar  on Twitter.


